Growing Global African
Reparations Movement
April 9-11, 2015,
New York City, NY, USA
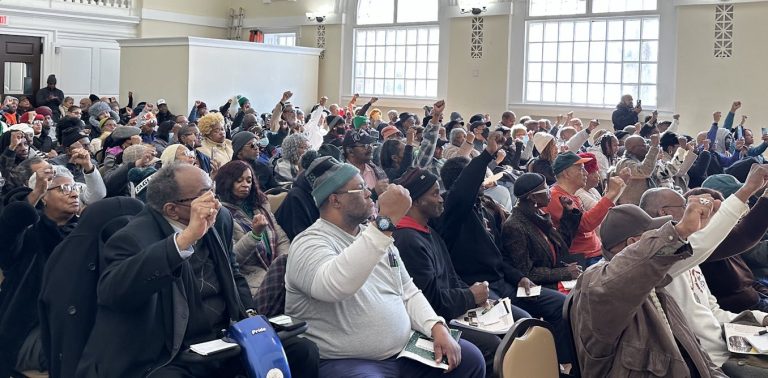
In the spirit of the Durban Declaration of 2001 which declared the Atlantic Slave Trade and chattel slavery as crimes against humanity, scores of representatives from the CARICOM Reparations Commission (CRC), the National African American Reparations Commission (NAARC) and representatives of emerging Commissions in Martinique, the U.S. Virgin Islands, Canada, United Kingdom and Europe gathered in New York, April 9-11, 2015 for a historic National/International Summit. Convened by the Institute of the Black World 21st Century, these representatives were joined by hundreds of Credentialed Observers from the U.S. and the Pan-African world, and hundreds of residents from the greater New York area who participated in the Reparations Rallies, a Tribute to Cong. John Conyers and the Business Sessions.
These participants from some twenty (20) countries in the Caribbean, Europe, Central, and South America, Canada and the USA gathered with a clear determination to strengthen the global movement to finish the continuous, heroic struggle of Africans on the continent and people of African descent everywhere for reparations to repair the damages inflicted on our peoples by genocide and enslavement at the hands of European colonial and slave-holding nations. In the memory of our ancestors, those who gathered for this historic Summit New York viewed the National/International Summit as the beginning of the final stage in the long historical process of seeking reparatory justice, for the monstrous crimes of African enslavement and native genocide.
Reparations Summit Resolutions, Pronouncements and Action Items
It is in that spirit that the Summit adopted the following Resolutions, Pronouncements and Action Items:
1. Agreed to consolidate and expand the growing African global reparations movement by calling on civil society organizations and governments in countries where there is a legacy of enslavement to establish national reparations commissions or committees. Such commissions and committees should place a particular priority on educating, mobilizing and organizing young people. In that regard, the Summit agreed to connect with and engage the #BlackLivesMatter Movement in the United States and globally.
2. Agreed that the CARICOM Reparations Commission (CRC), which is demanding compensation/restitution from the former European colonialists for Native Genocide and African enslavement, will support the National African-American Reparations Commission (NAARC) by encouraging and facilitating Caribbean political leaders, artists, civil society activists and scholars to participate in various NAARC educational and mobilizing/organizing initiatives in the months and years ahead.
3. NAARC recognized the extraordinary value of the vision/mission of CARICOM in establishing the Reparations Commission and pledged to support the commission in its milestone programmatic and mobilizing/organizing work in whatever ways are feasible.
4. Agreed to welcome the establishment of reparations commissions in Europe, Britain and Canada that share the mission and values of the CRC and NAARC, and to seek meetings with such commissions in the near future.
5. Agreed to convene a Global Summit in Europe at the earliest practical date to take CARICOM’S demand for reparations for Native Genocide and African enslavement into the homes of the offending nations. In addition, it was agreed that a global summit of reparations commissions and aspiring bodies be convened in the Caribbean in 2017.
6. Called upon the CARICOM Heads of Government to proceed urgently with the recommendation that the slave-owning and slave-trading European nations be invited to attend an inter-governmental reparatory justice summit in 2015.
7. Recognized U.S. Cong. John Conyers, Jr., as a champion of the reparations movement and as the consistent sponsor of HR-40, the reparations study bill in the US Congress, and urged the Congressional Black Caucus, major civil and human rights, faith, labor and civic organizations in the USA to support the global reparations movement.
8. Declared a Decade for Reparations and in that context, applauded the General Assembly of the United Nations on the Declaration of 2015-2024 as the Decade for People of African descent which should advance the demand for reparations. The Summit expressed strong support for the UN Decade’s program of activities. It also called on member states of the U.N. to officially launch the Decade. The Summit further applauded UNESCO for its continued support of the ‘Slave Routes Project’ and the ‘General History of Africa Project’.
9. Applauded the government of Brazil for making mandatory the study of African history and culture at all levels of the educational system in that country and called on all countries with African-descended populations to do likewise and also to recognize the validity of traditional African spiritual and religious systems.
10. Called on the global reparations movement to develop sustainable funding strategies and called on the international community to work towards a 21st Century new moral order for sustainable development in which reparatory justice is an integral component.
Contact: [email protected] ♦ www.ibw21.org ♦ 410. 844.1031 |


